ANALYTICS

Unlock the power of queue analytics

Regardless of your sector or location, Moviik Analytics provides real-time and predictive insights to help you improve customer experience, streamline operations, and spur growth.

Business Intelligence for smarter decisions

Every consumer encounter is transformed into useful insights by Moviik’s sophisticated analytics. You can optimize queue management, boost customer satisfaction, and increase service efficiency with real-time data and on-demand reporting.

From a web-accessible dashboard, you can clearly understand staff performance, wait times, and visitor flow.

Create and customize Dashboards and Reports from scratch

Moviik Analytics allows you to create custom dashboards and reports for your company without the need for coding or IT assistance. Create graphics that make sense for your operations by selecting the data you wish to view and using filters like location or time period.

Everything is simple to set up and immediately actionable, whether it’s daily performance or long-term patterns.

Key benefits of Moviik Analytics

data-driven insights to boost customer satisfaction, streamline processes, and make better decisions.

Data-Driven Decisions

Make well-informed decisions based on historical and real-time data.

Real-Time Insights

Instantaneously monitor important data points and modify your tactics.
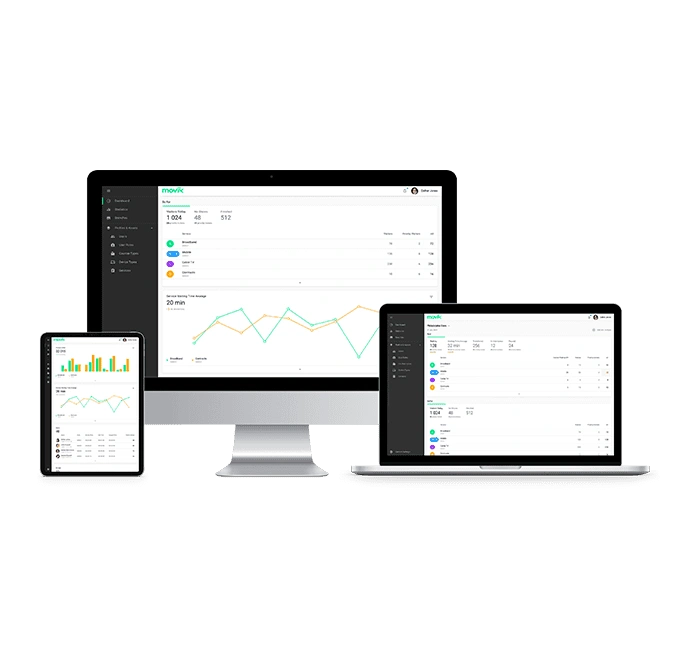
Web-Based Access

Remotely access your analytics to maximize service effectiveness.

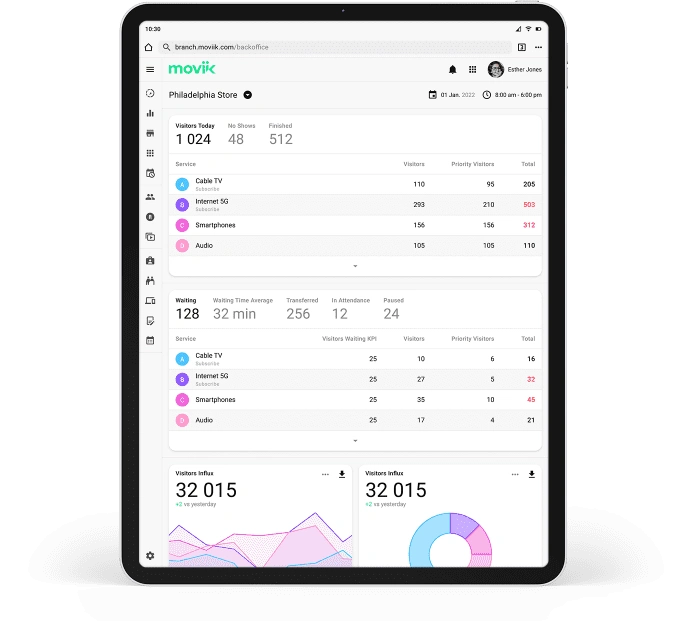
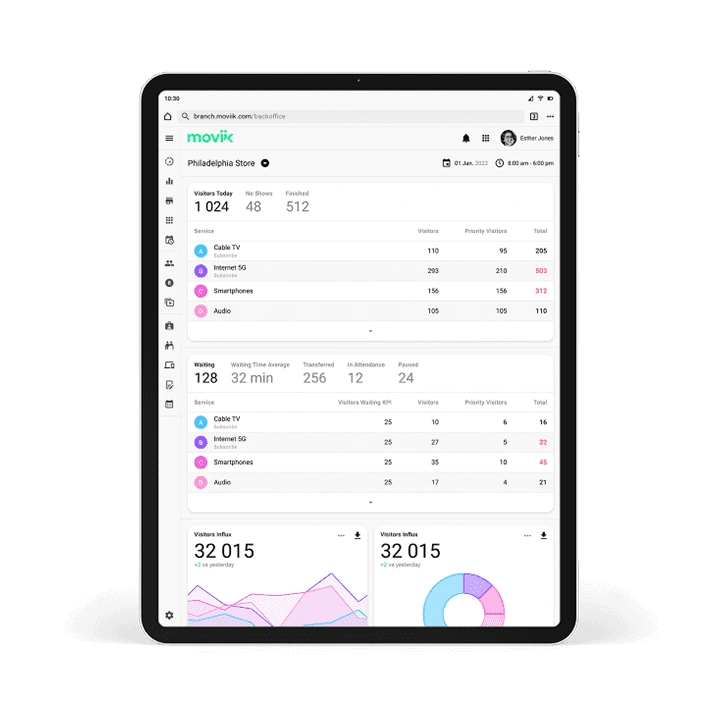
Comprehensive Reporting

Examine visitor flow, wait times, and agent effectiveness.

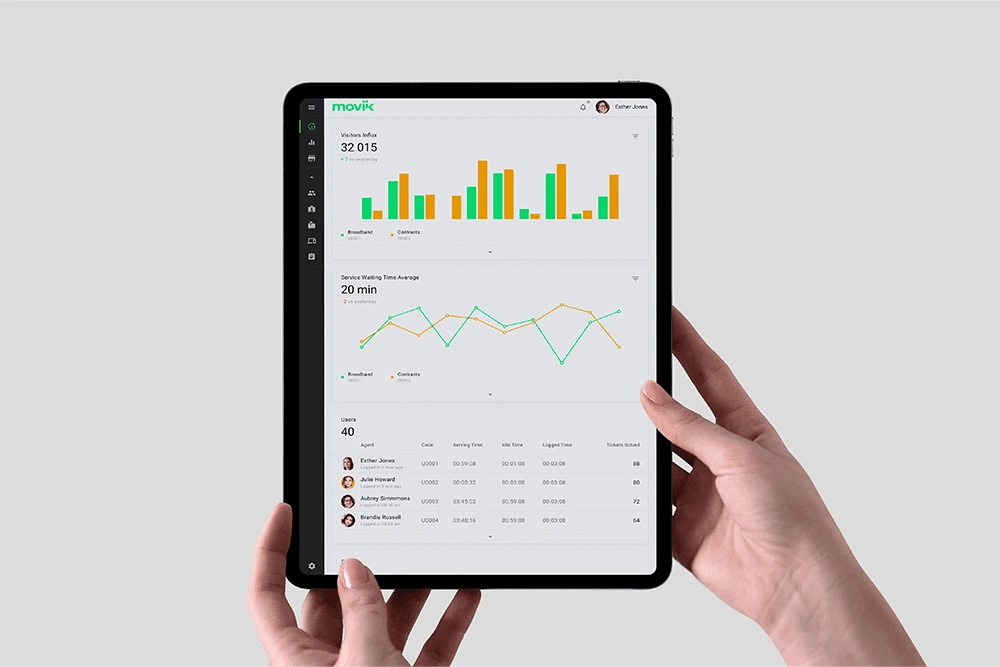
Performance Tracking

Examine performance, wait and service times, and visitor flow.

Downloadable Reports

Extract comprehensive reports about operations, service performance, and branches.

Heat Mapping

Use heatmaps to identify peak hours and allocate staff as efficiently as possible.

Actionable Metrics

Keep an eye on KPIs such as client flow, wait times, and service durations.

Measurable results that matter

Customers of Moviik Analytics usually observe notable gains in a number of important performance metrics:

Reduction in wait times up to

45%

Decrease in no-shows up to

70%

Increase in staff efficiency up to

35%

Operational cost reduction up to

25%

Centralized data and insights across all your locations

Set up everything, including who can see it and what you can see. Deliver the appropriate information to the appropriate individuals at the precise moment they require it.

Personalized Configuration

Use role-based access and visibility controls to customize views for teams.

Smart Filters & Time Ranges

Use customizable time intervals and filters to drill down by team, location, or service.

Custom Datasets

Get reports delivered to important decision-makers on a daily, weekly, or monthly basis.

Scheduled Reports

For more in-depth data analysis and reporting, sync with BigQuery or download CSV and Excel files.

Turn data into decisions

Metrics that can be used to improve each stage of the customer journey

Track how many tickets are issued, served, canceled, and still waiting – essential KPIs to monitor service performance.

Understand how long visitors wait and how long they’re served, crucial for improving speed and reducing bottlenecks.

Visualize how visitors move through your space with real-time and historical heatmaps that reveal traffic and peak times.

Compare regular and priority services to see where demand is highest and how resources are allocated.

Monitor agent performance across branches or globally, including actions taken and time spent per customer.

See how each location is performing based on visitor volume, service times, and overall throughput.

Drill into ticket patterns, queue types, and flow disruptions to fine-tune desk setup and team efficiency.

Access and export your data anywhere

Access insights anytime, from anywhere – no VPNs or local servers required.

Export to CSV and Excel

Download and analyze data with ease using the tools of your choice.

Google BigQuery Integration

Sync your data with BigQuery to enable machine learning and more in-depth BI analysis.

Access and export your data anywhere

Access insights anytime, from anywhere – no VPNs or local servers required.

AWS-Powered Infrastructure

Take benefit of agility, safety, & reliability wherever you work.

Flexible
Integrations

To meet your current workflows, connect using REST API.

User-Friendly Interface

Get things run fast with facing IT issues of a high skill curve.

Ready for
Tomorrow

Moviik supports complex analytics and changes with you.